Zones of Theoretical Visibility (ZTVs)
Our ZTVs are based on England’s national LiDAR survey 2023 (© Environment Agency copyright and/or database right 2022. All rights reserved.). While this data is limited to England where other datasets are available those can be used instead but may be of a different quality. We use the 1m Digital Surface Model (DSM) which includes some vegetation and buildings making our ZTVs more accurate than those based purely on elevation data. ZTVs are essential to understanding where may experience visual impacts from new developments and therefore play a key role in planning.
It is important to note that ZTVs do not quantify the visual impact of features as while they may be visible they may be partially obscured or may blend into the landscape. Our ZTVs can give either one unified area where any part of the target feature may be seen or a more nuanced view showing the number of target features that can be seen as shown on the right
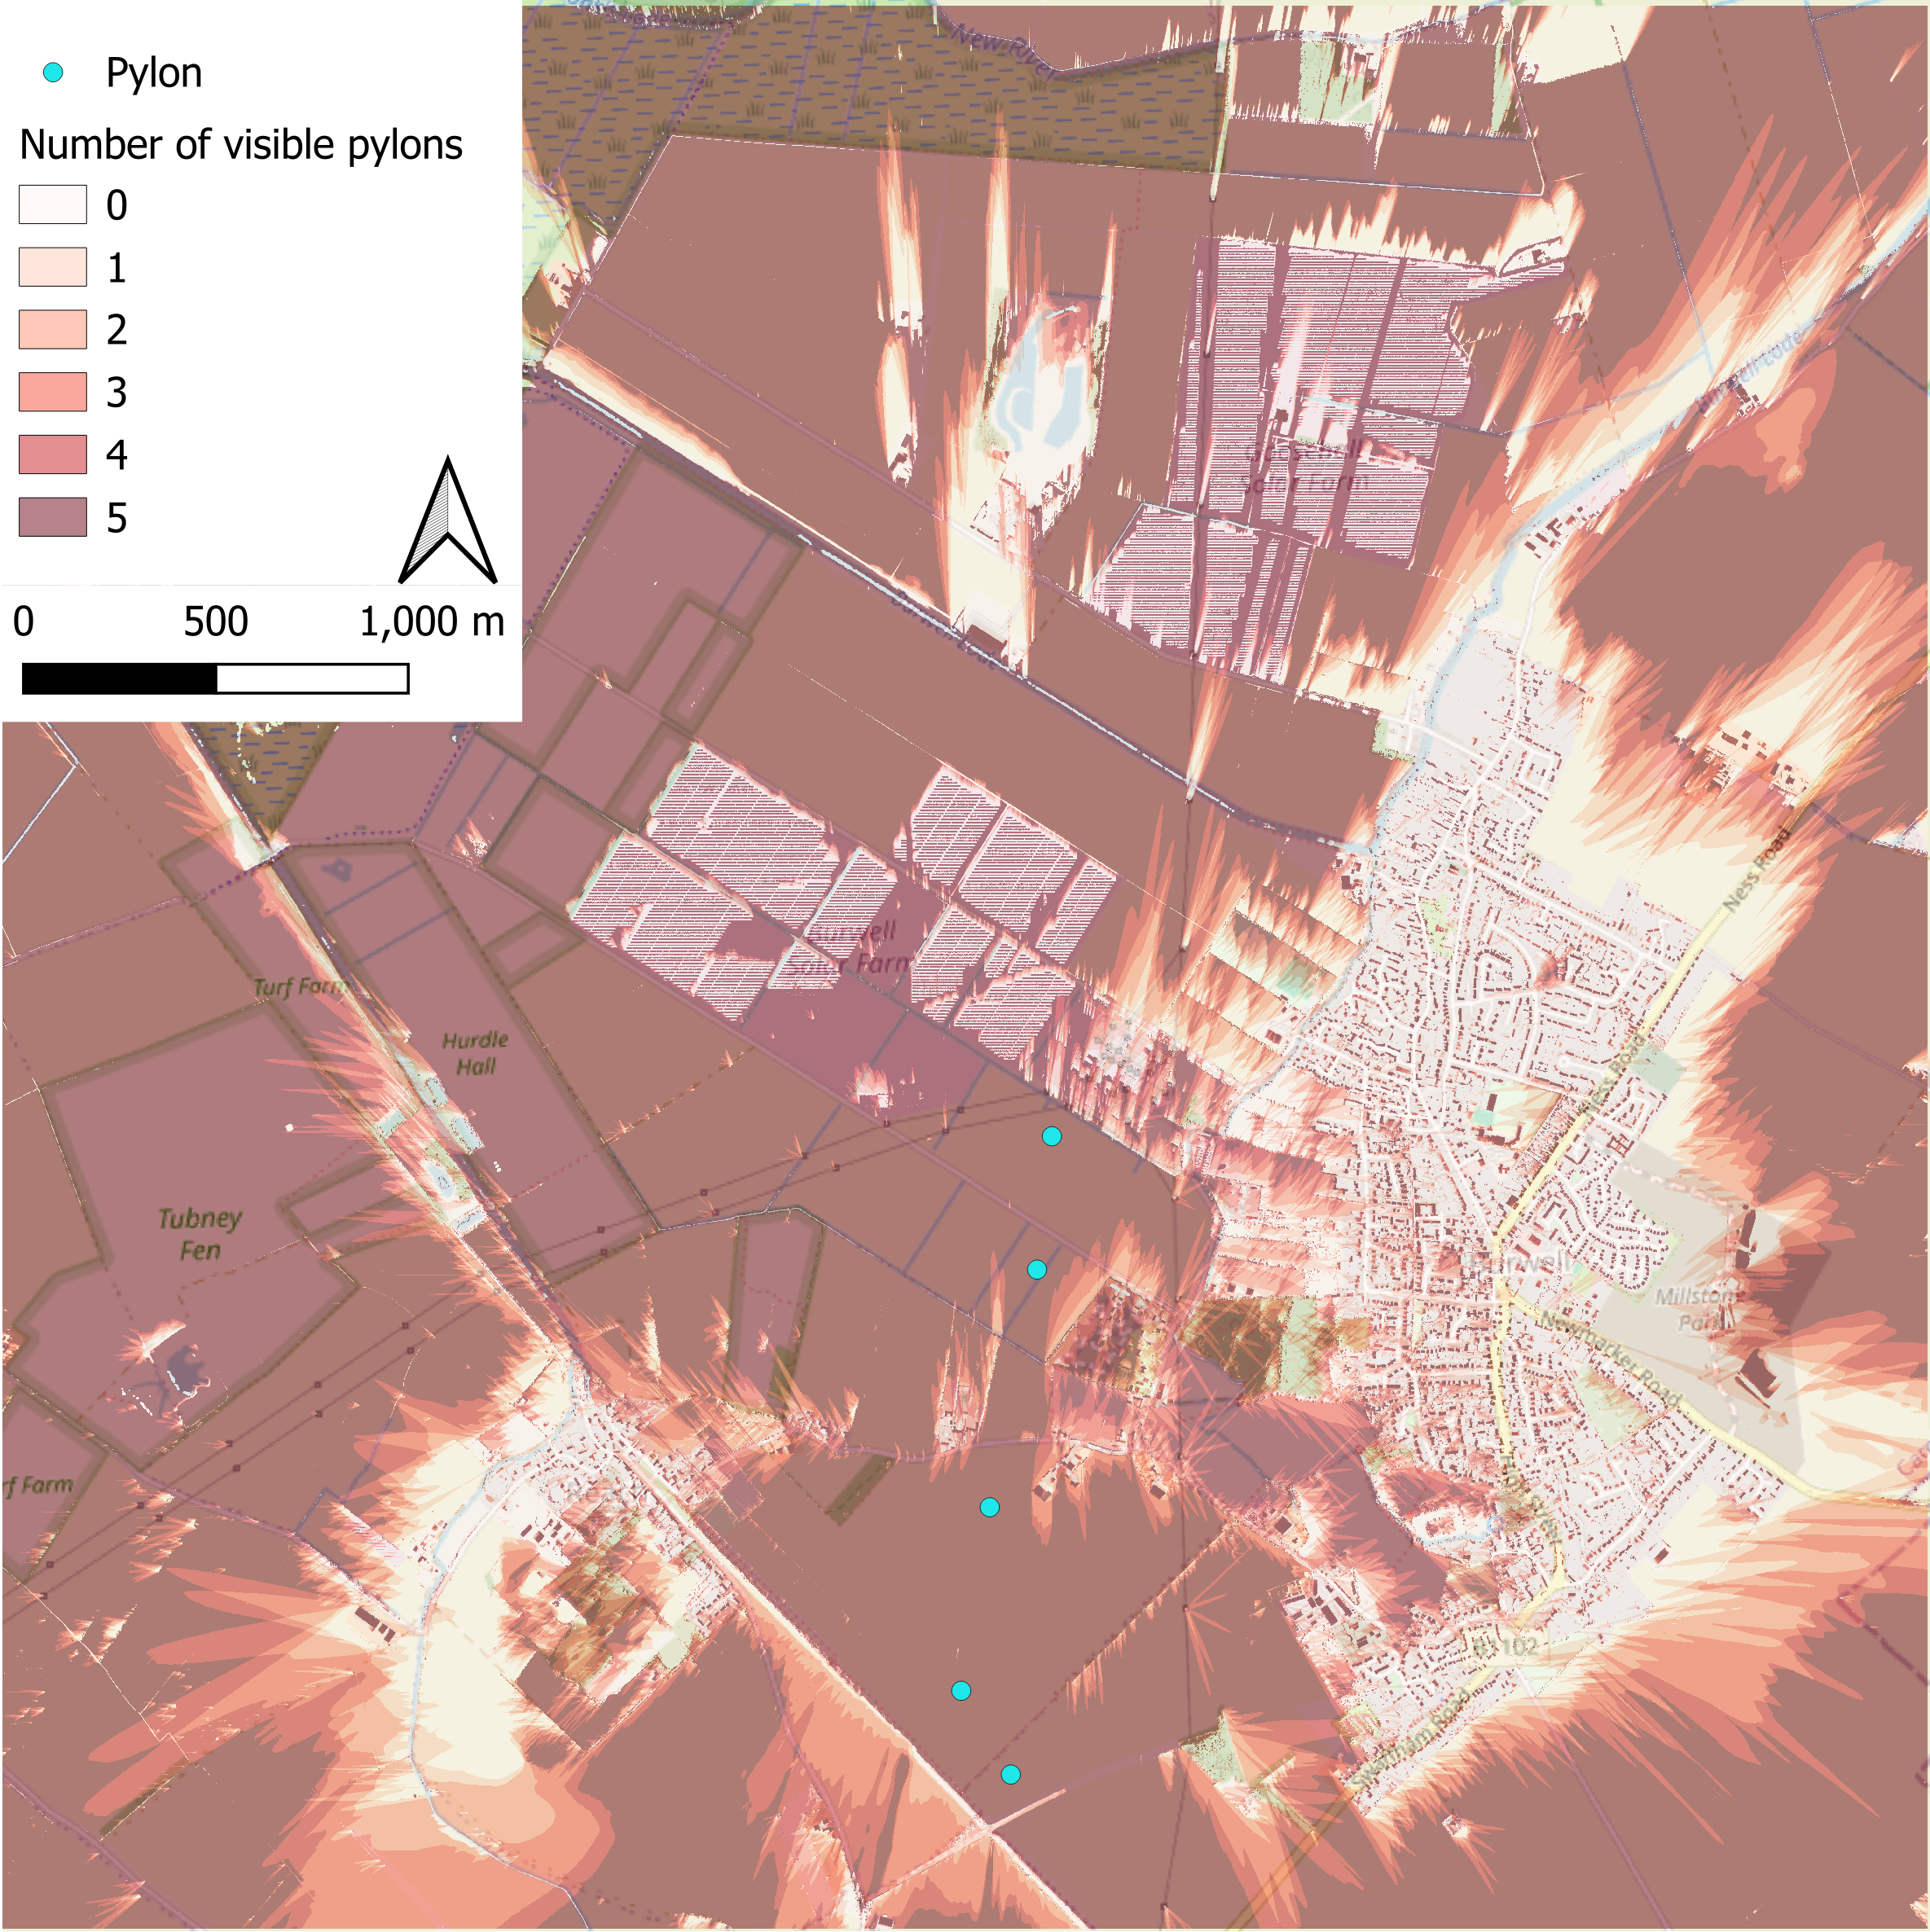
A ZTV for a possible future infrastructure project near the village of Burwell, Cambridgeshire involving 5 50m tall pylons and where they would be visible from at eye level, 1.6m.
Satellite Imagery/Analysis
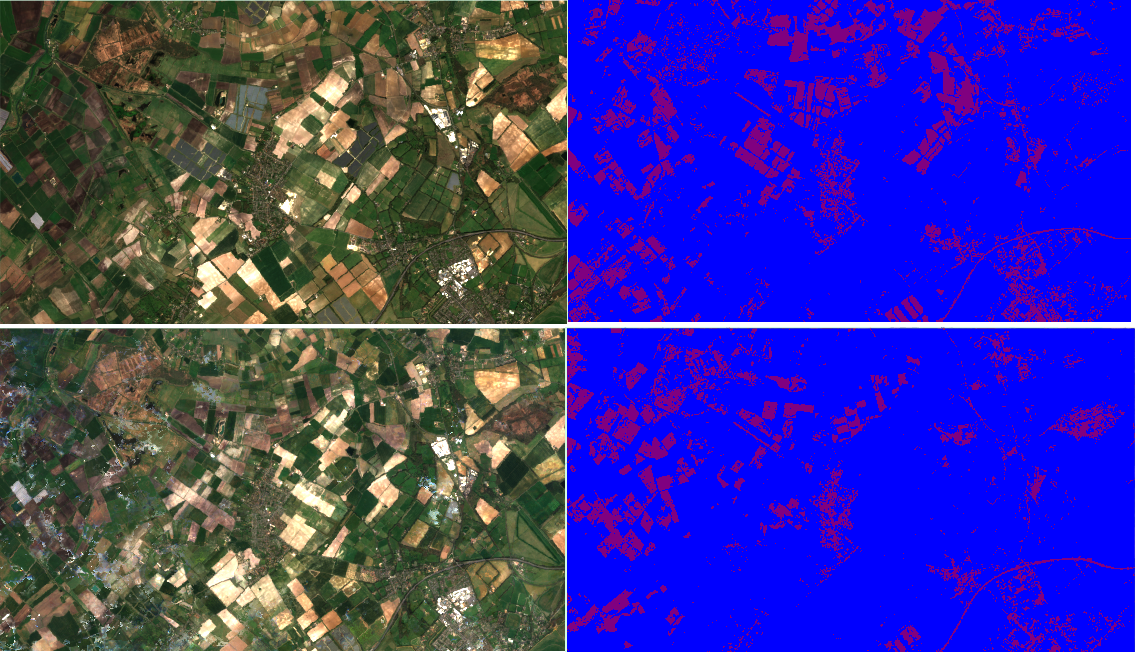
Comparison showing how satellite imagery and land classification, built up (red) and not built up (blue), can be used to identify the locations and collective extent of new developments. This area is a section of land in Cambridgeshire just north of Newmarket. The top is from 2025 and the bottom is from 2019. The most obvious change is the appearance of 4 new solar farms in the north central part of the view, appearing in red as rectangles with neat blue lines between. The disappearance of the large patchwork of red in the north-west is result of limitations in separating the appearance of bare land with built up land.
We offer processing of some satellite imagery, primarily from the Landsat and Sentinel satellite constellations. This includes timelapse imagery creating cloud free or reduced cloud composite images and a range of possible analysis including land classification. On the left is an example of a simple land classification and below is an example of some timelapse imagery.
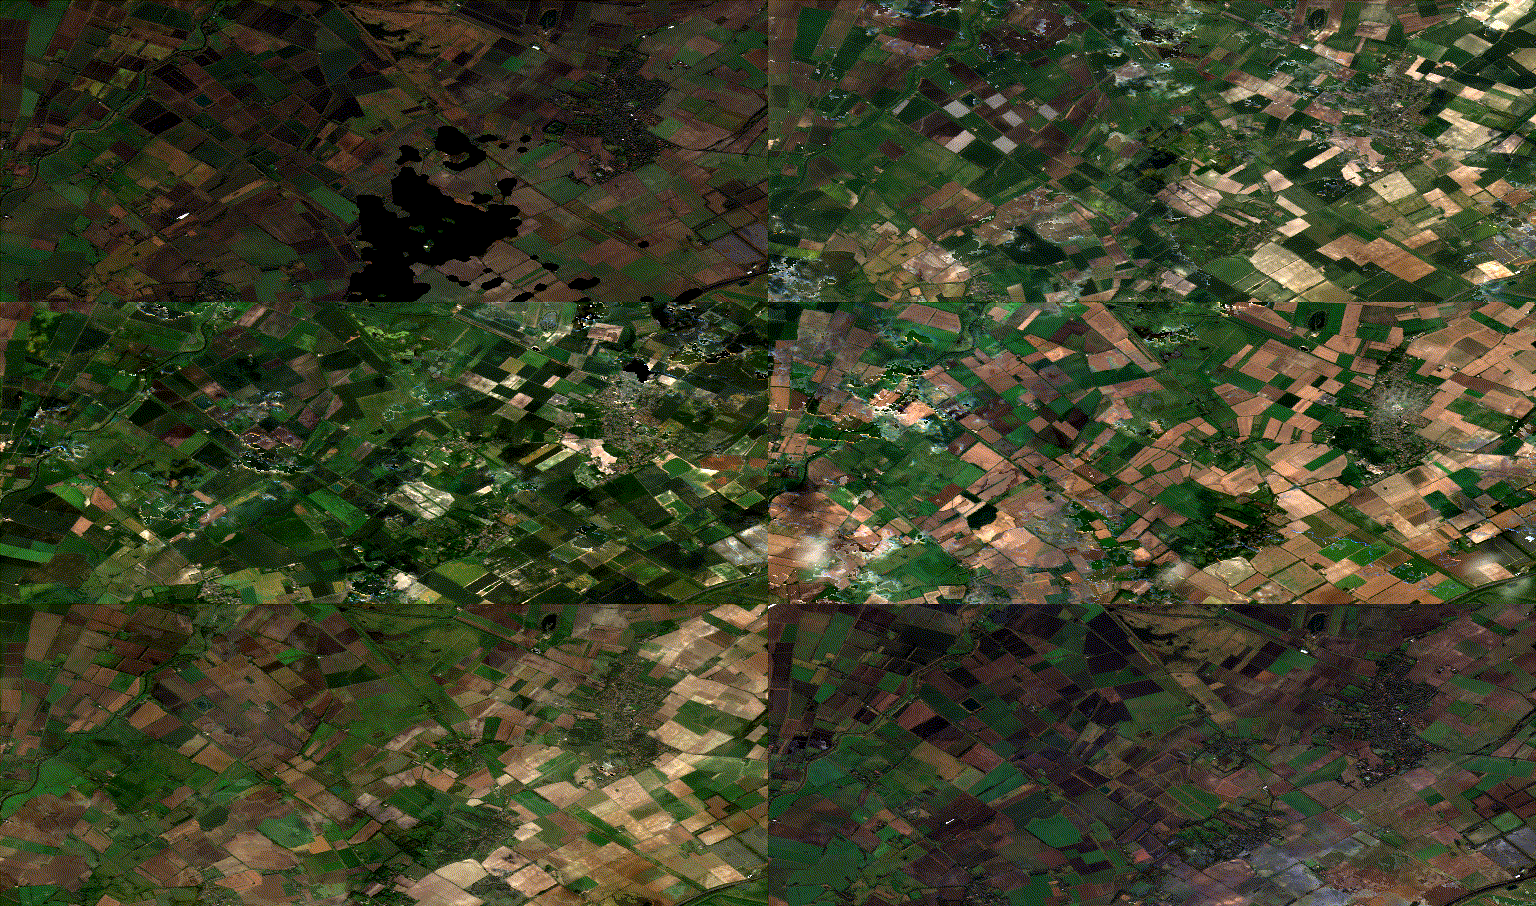
GIF showing a monthly timelapse of an area of land in the East of England. Created using Sentinel 2 imagery processed in Google Earth Engine.
The black areas and cloudy areas are left over from the cloud removal process and represent areas that had no cloud free days in the month for that frame. This issue also contributed to the overall darkness in some frames.
Aerial Photography
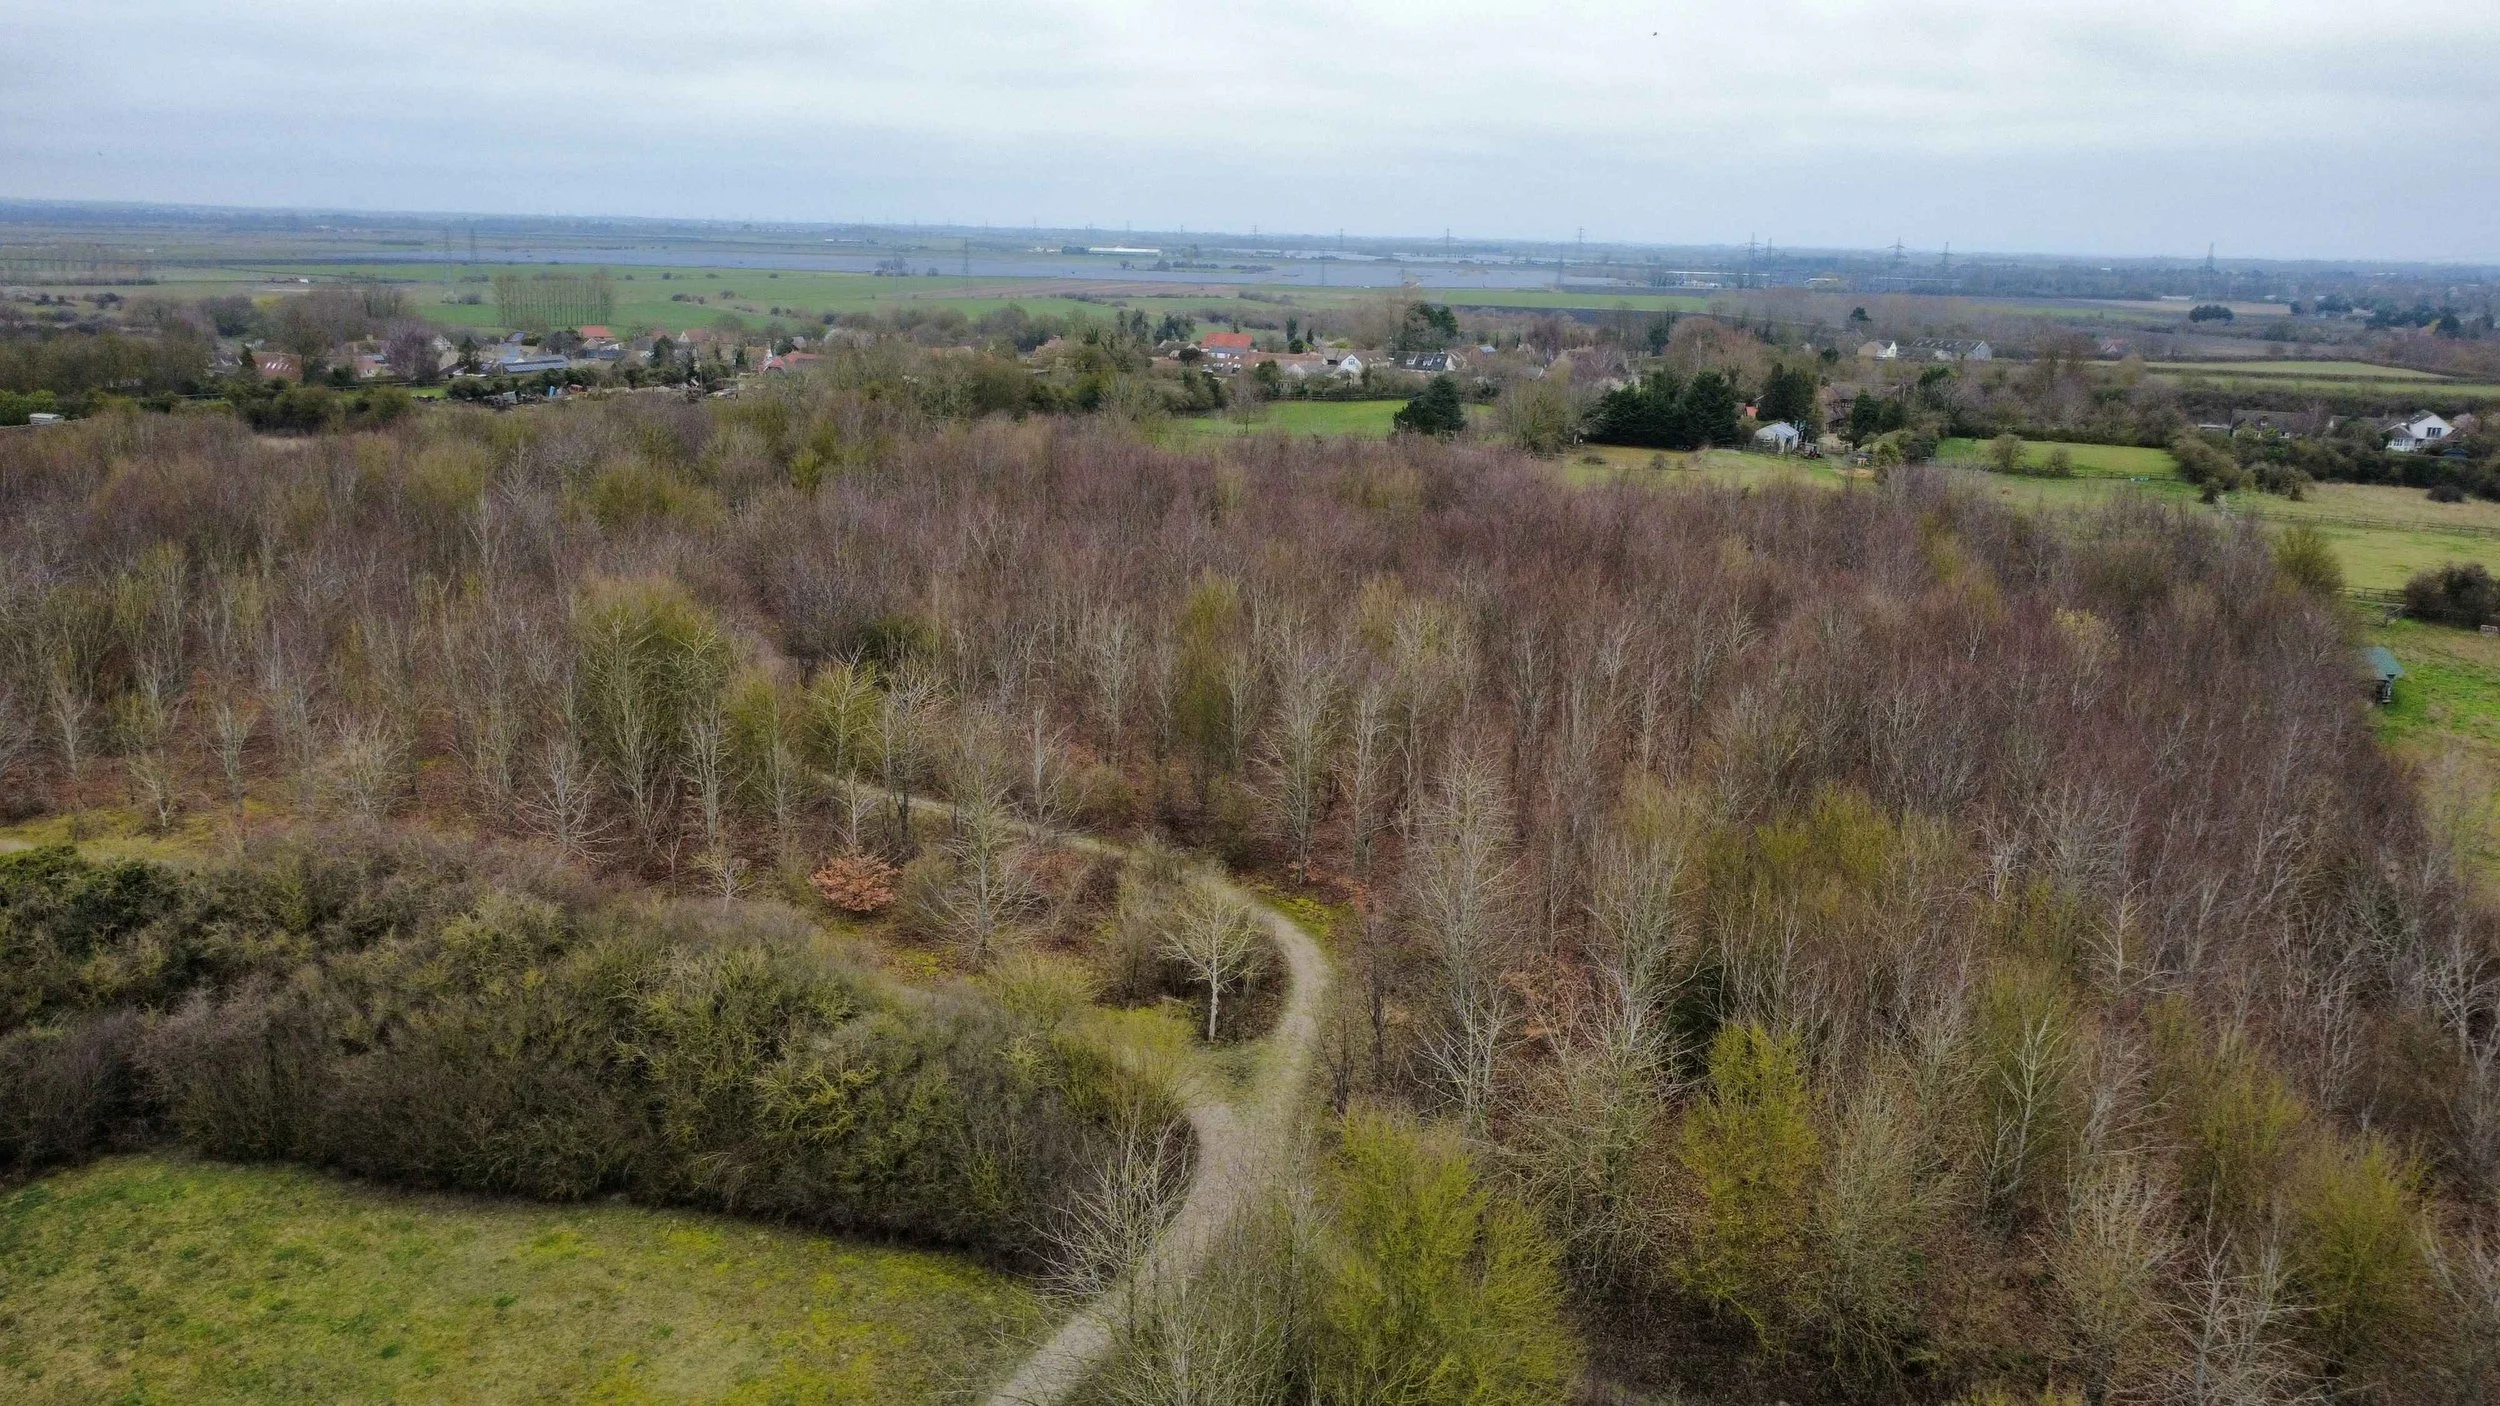
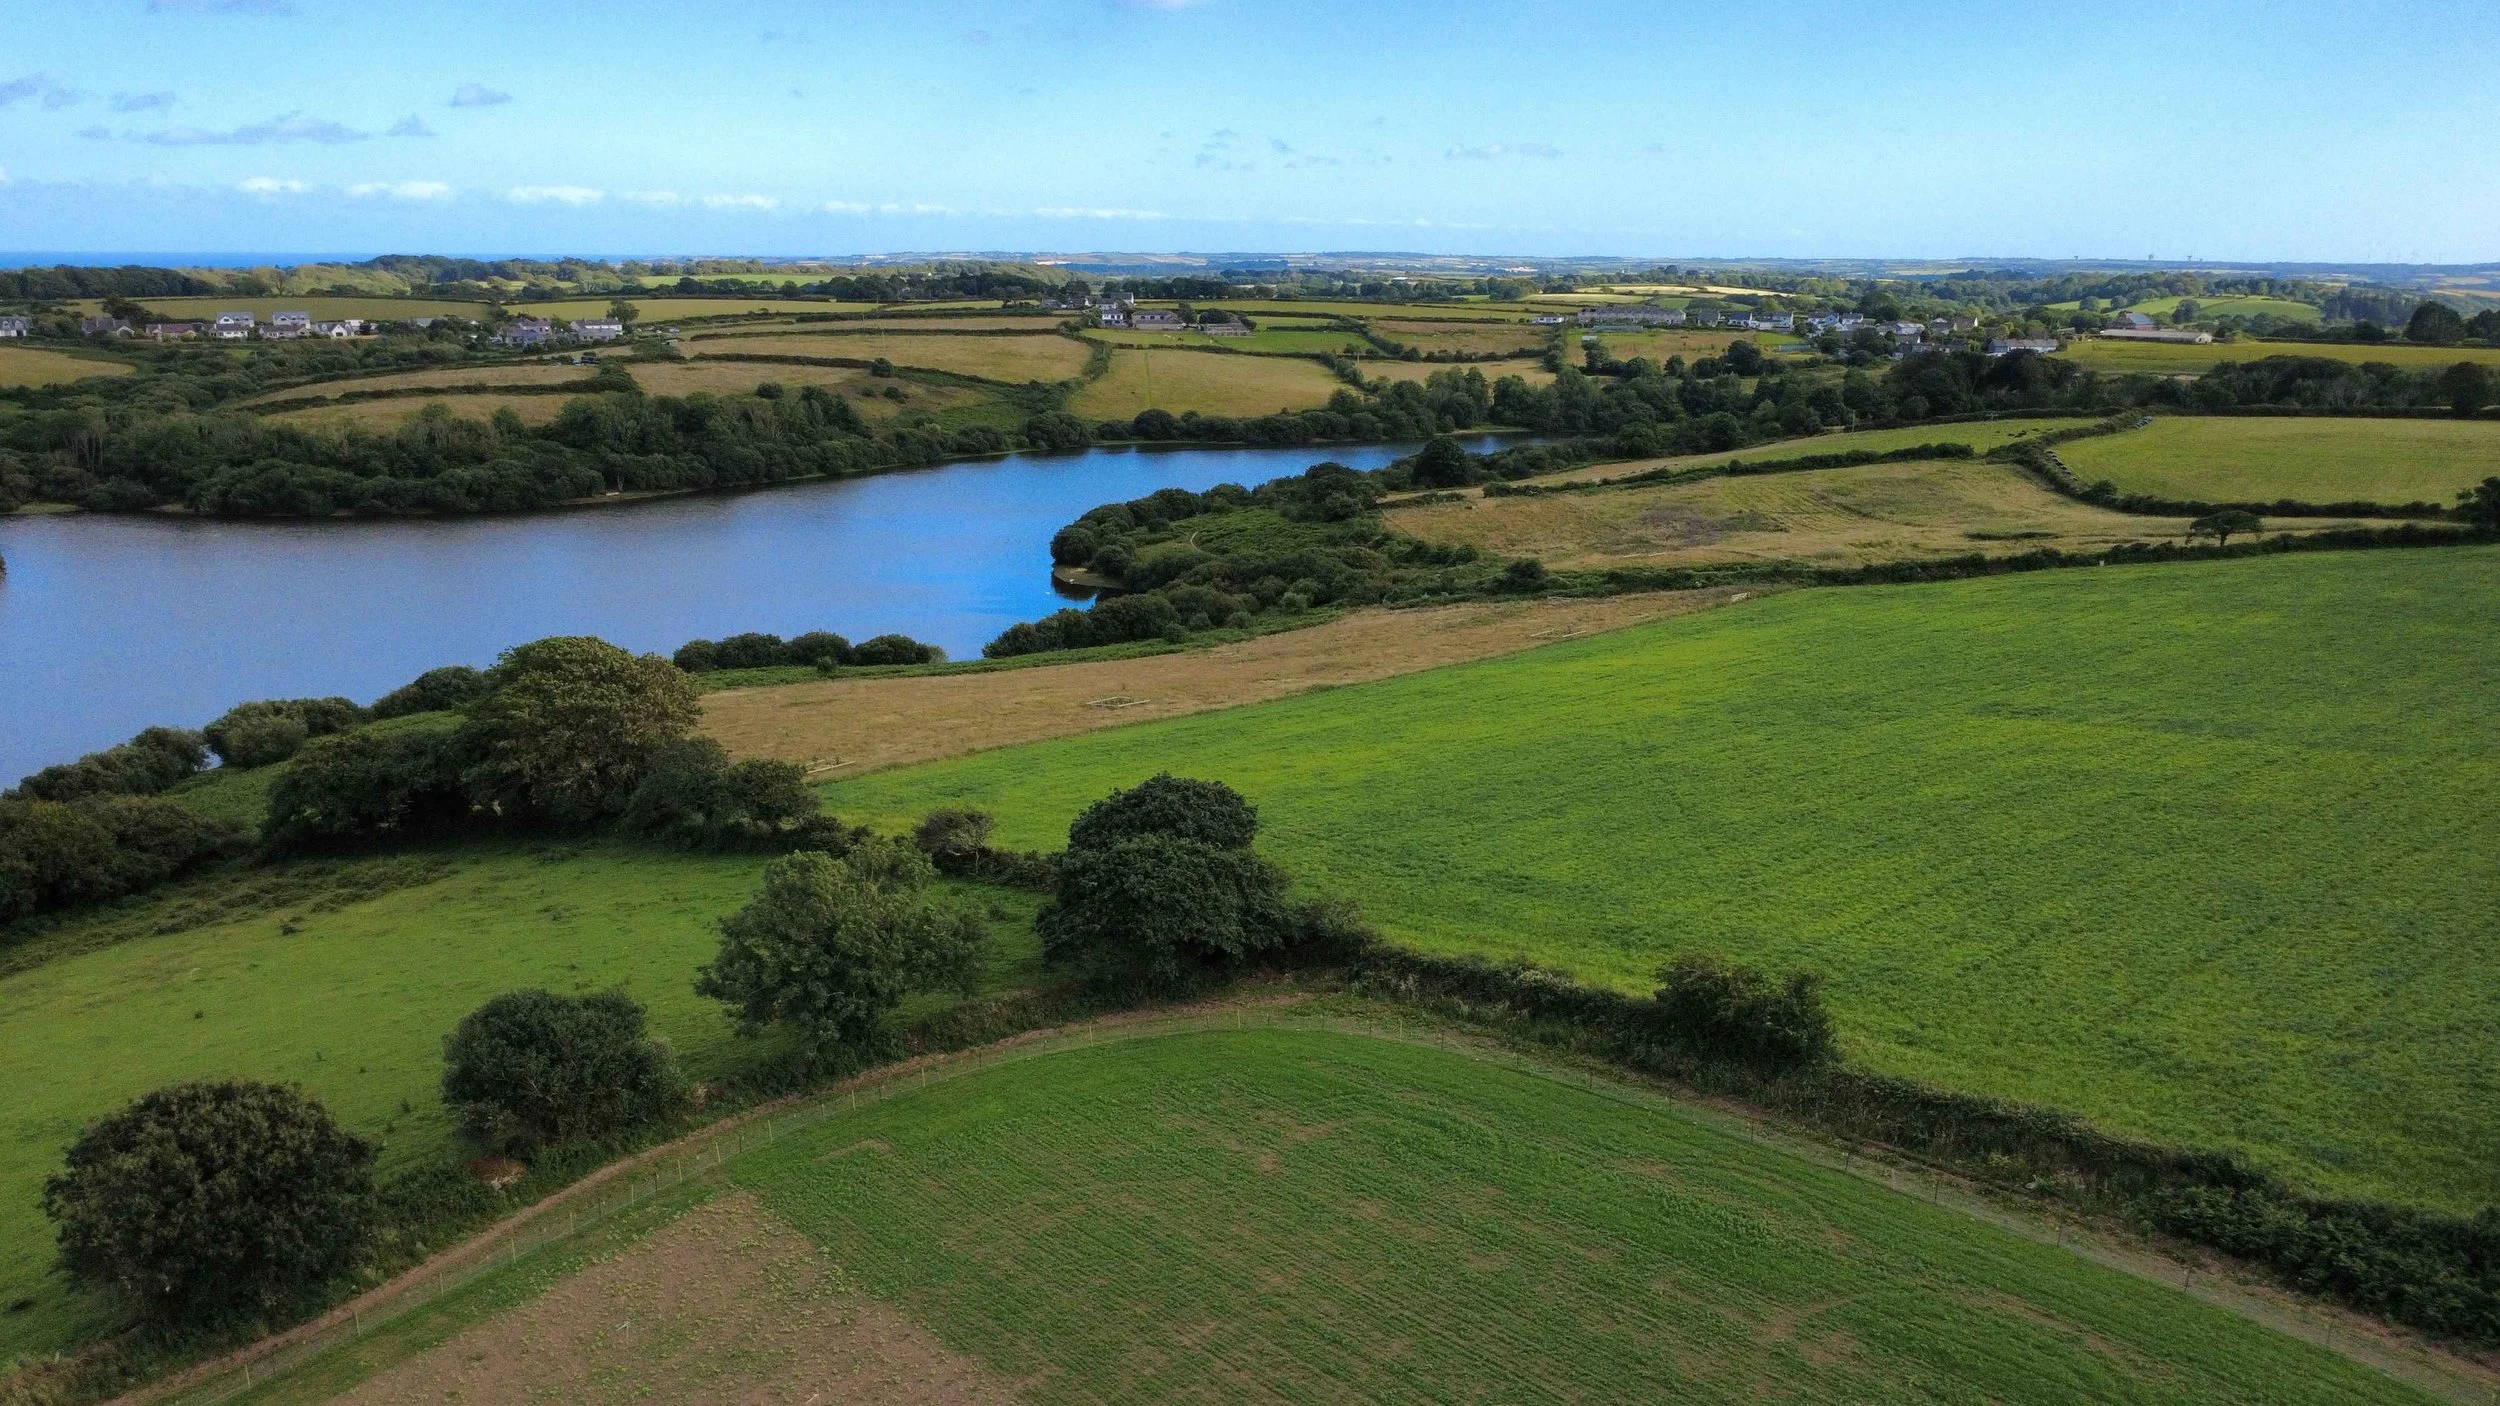
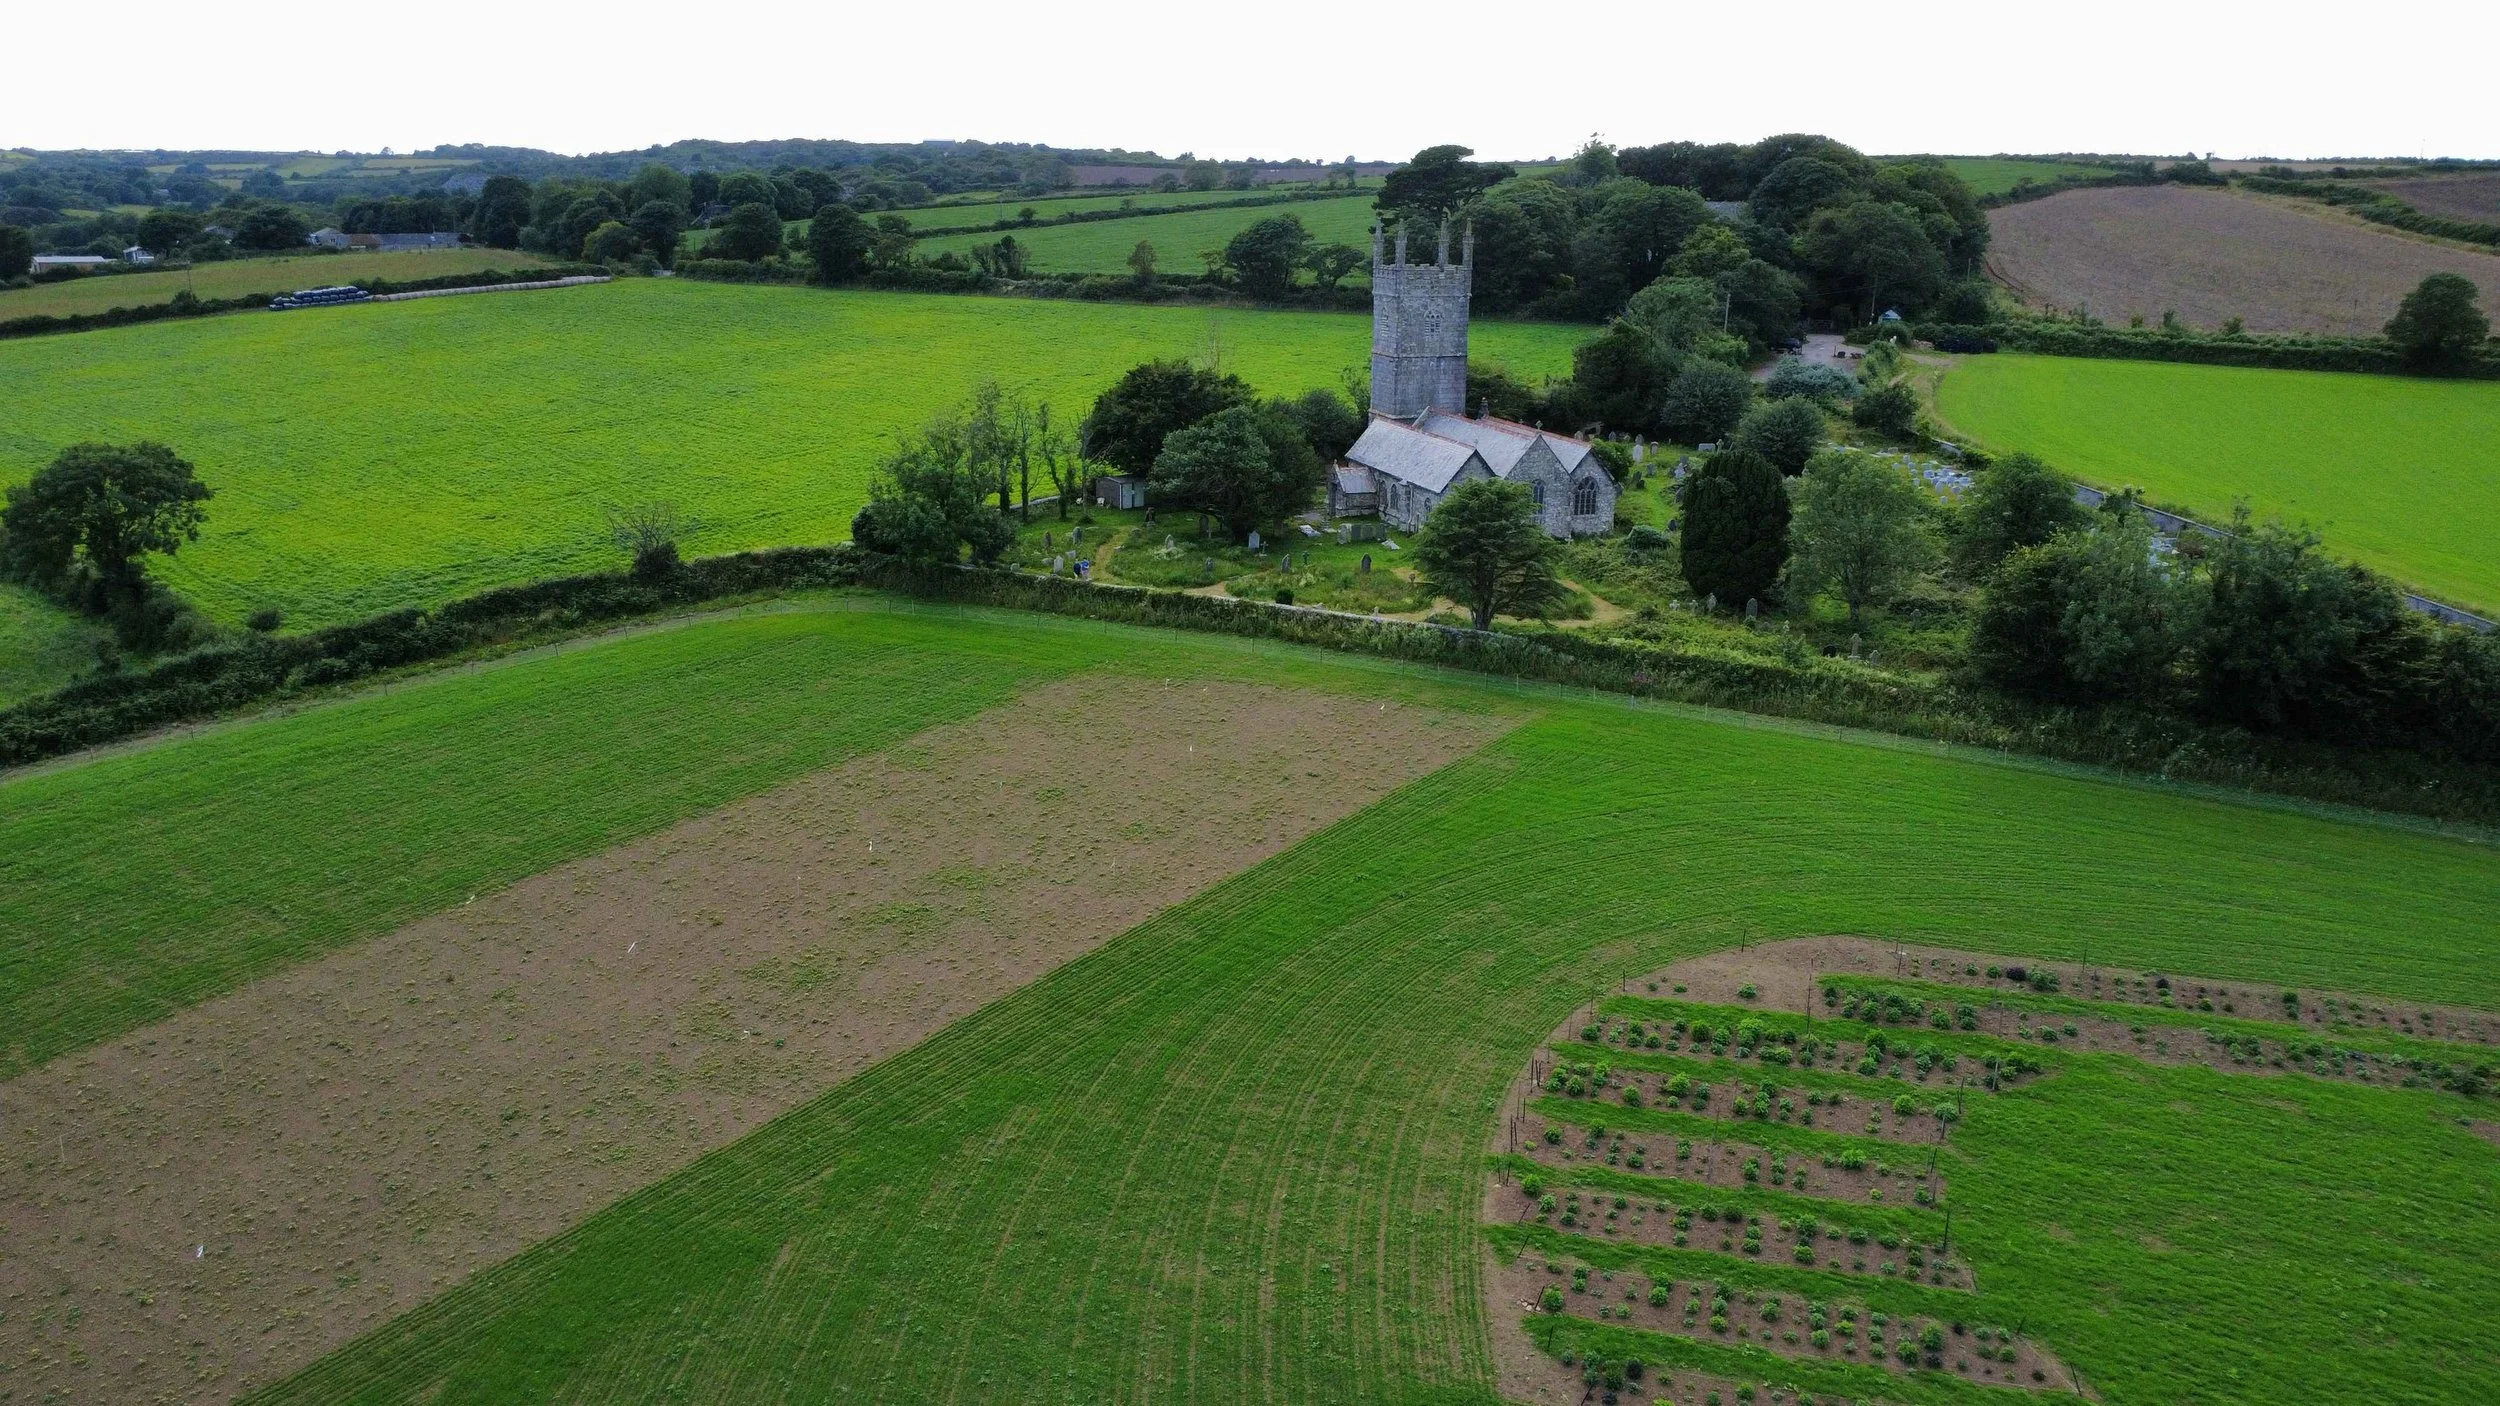
In some parts of England we offer drone based aerial photography. This could be used for a wide range of purposes. We are insured for commercial drone flights, however this does not remove the standard flying limitations which may limit the events or locations that we can take imagery for. All images here are taken by us.
Photogrammetry
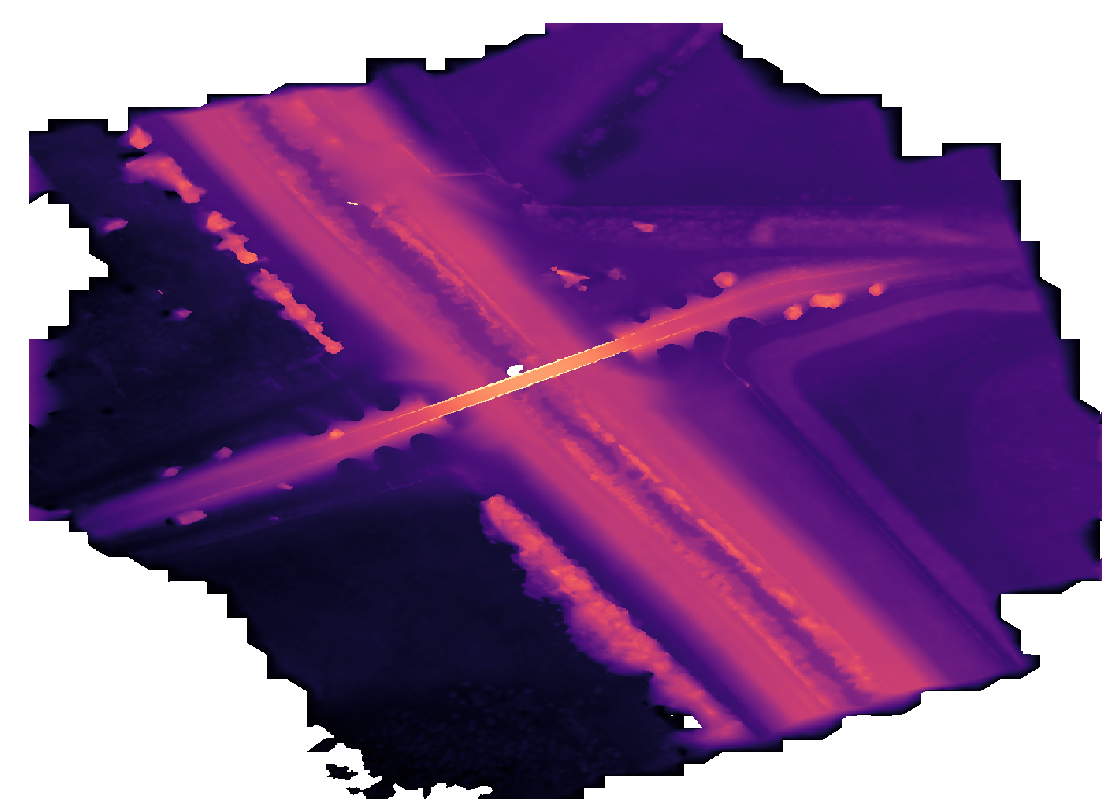
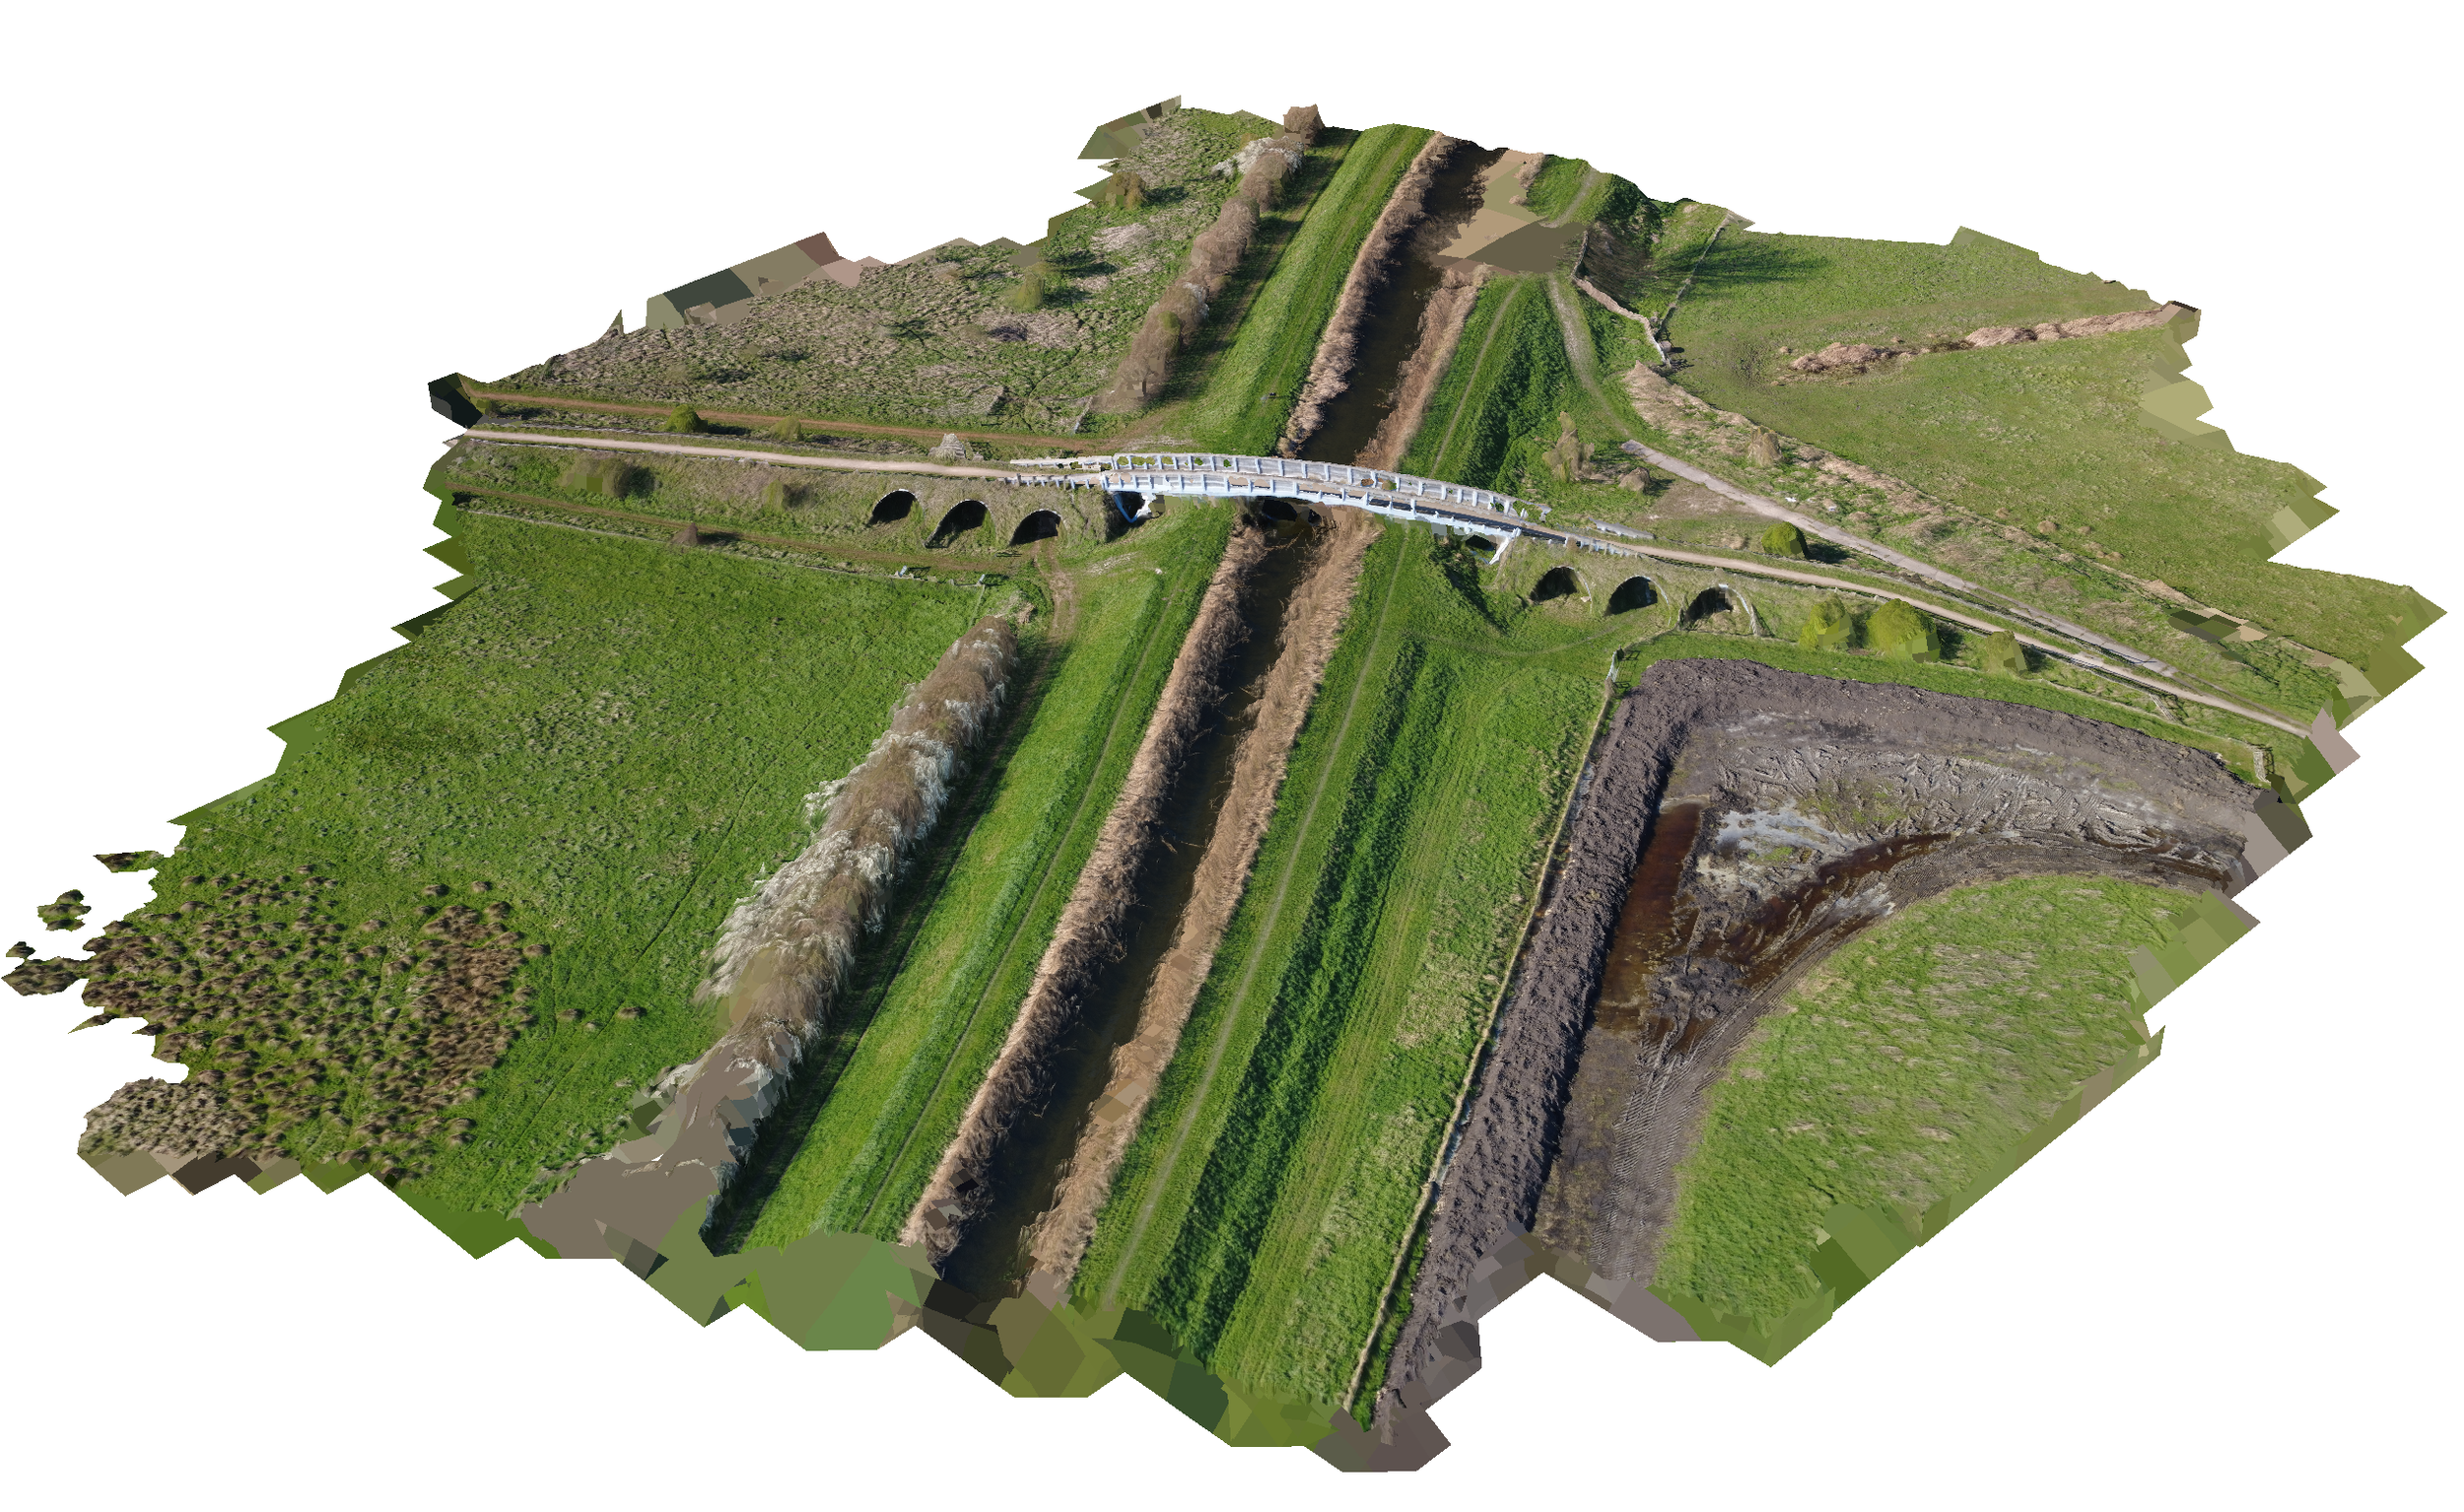
In some parts of England we can provide simple illustrative photogrammetric surveys. These can provide detailed DSMs using local coordinates when a 1m resolution is not sufficient. However we cannot currently offer the highest quality surveys due to limited equipment.
Other Services
While these are our primary services we can offer other services including independent advice and review of other work and general support. If you are uncertain if we can help please contact us and we can discuss your particular needs and see how we can help.
Pricing
For community, non-profit and charity projects our work is offered with a pay as wish structure meaning if we take on your project you will only ever pay as much as you want for the work you receive.
For other users of our services pricing depends on which services are wanted, the physical location of the project as well as the scale and complexity of the work wanted. If you are interested please contact us and a free initial discussion can be arranged.